May 2 COVID-19 Update
Nova Scotia Update:
2 new deaths
0 new hospitalizations, 1 released
0 new ICU cases
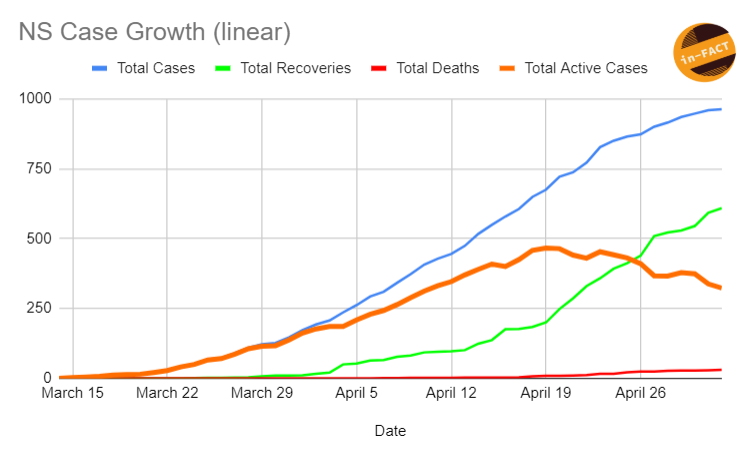
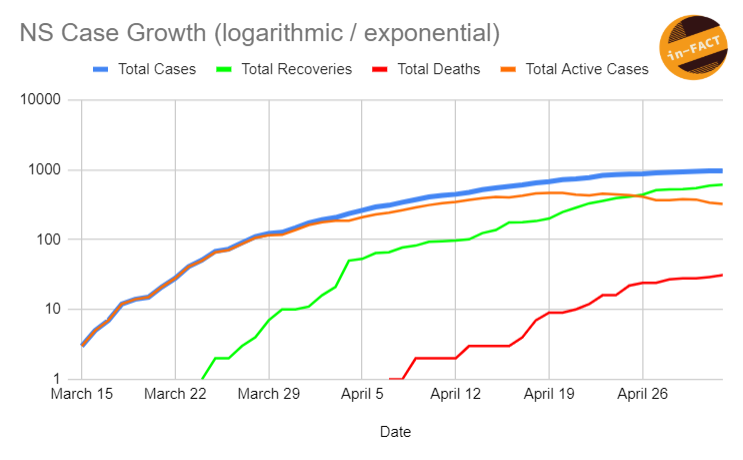
4 new cases (963 total)
866 tests done
17 more people recovered (609 total)
323 active cases (-15, 34% of cases are active, 66% are concluded)
NS has 2 new deaths today, both occurred at Northwood, unfortunately. 25/31 (81%) NS deaths are from Northwood and 29/31 are from long term care in general (10 different facilities are reporting cases). As it stands, 94% (+1%) of deaths and 37% (+1%) of all cases (348/963) are from long term care facilities. Outside of LTC, NS continues to perform very well day after day. Yesterday, 866 tests were completed with just 4 new cases reported, by far the best day yet. 66% (+1%) of ALL cases since day 1 are now concluded. As of yesterday, I estimate just 62 cases are active outside of LTC facilities (New visual will be updated daily once Northwood updates their figures, see previous post today)
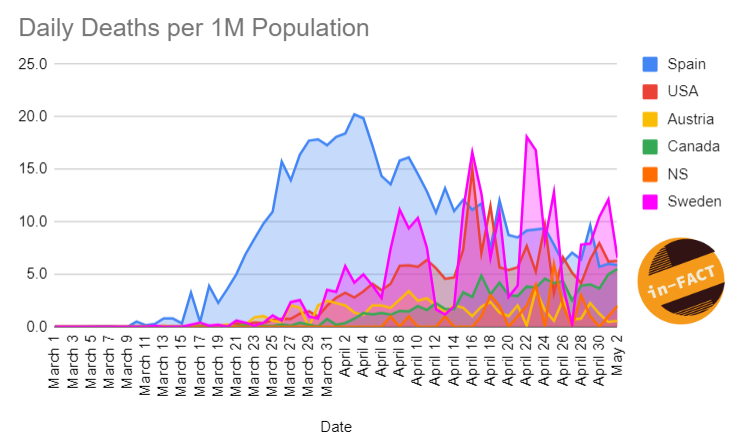
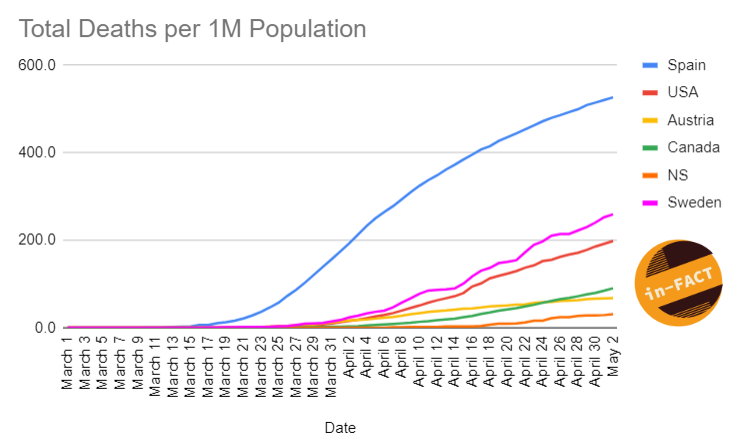
- NS has 31 deaths, making the death rate 31/1M population
- Canada's rate sitting at 90/1M
- Global rate is 30.8/1M
- US rate is 198/1M
- Austria rate is 67/1M
- Spain is 527/1M
- Sweden is 259/1M
Notable points for today:
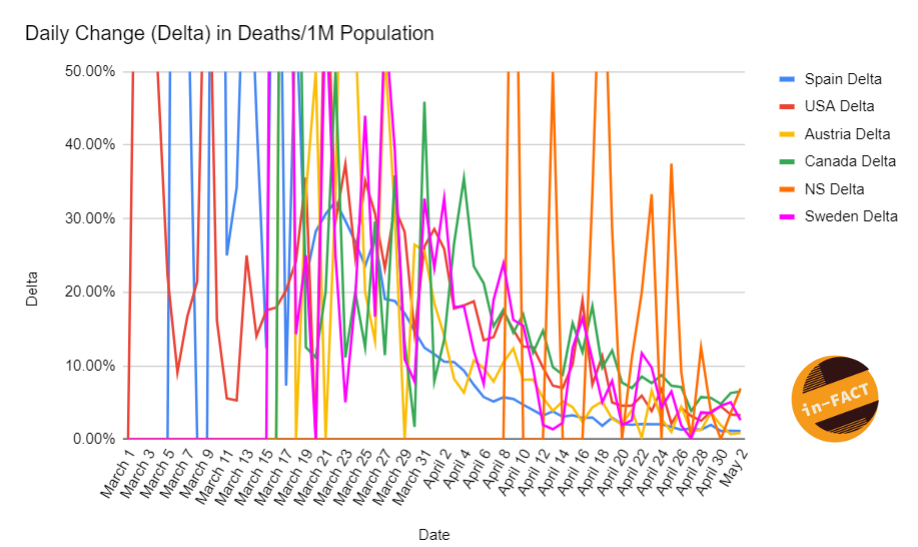
- Spain's rate of increase maintained itself at just over 1% for the 3rd straight day, Absolutely fantastic news again.
- Austria maintained their rate of increase well under 1%, more good news.
- The rate of death in Canada increased slightly again, by 6.5% with the highest single daily death toll we have seen, breaking 200 for the 1st time. Not the news I was hoping for but still in line with where we have been the last couple weeks.
- The US rate of increase maintained itself at just over 3%, so a good day for the Americans overall but would like to see that start to decrease soon.
- Sweden also had a significantly decrease yesterday with an increase of around 2.5%.
- Great news in Europe, hopefully tides in North America starting to turn as well.
Note, the 3rd visual I changed the vertical axis so it only shows a max increased of 50%,this is to allow you to better see the change in results since they are typically in the 5% range or less for each country now