inFACT COVID-19 Visuals - Part 2
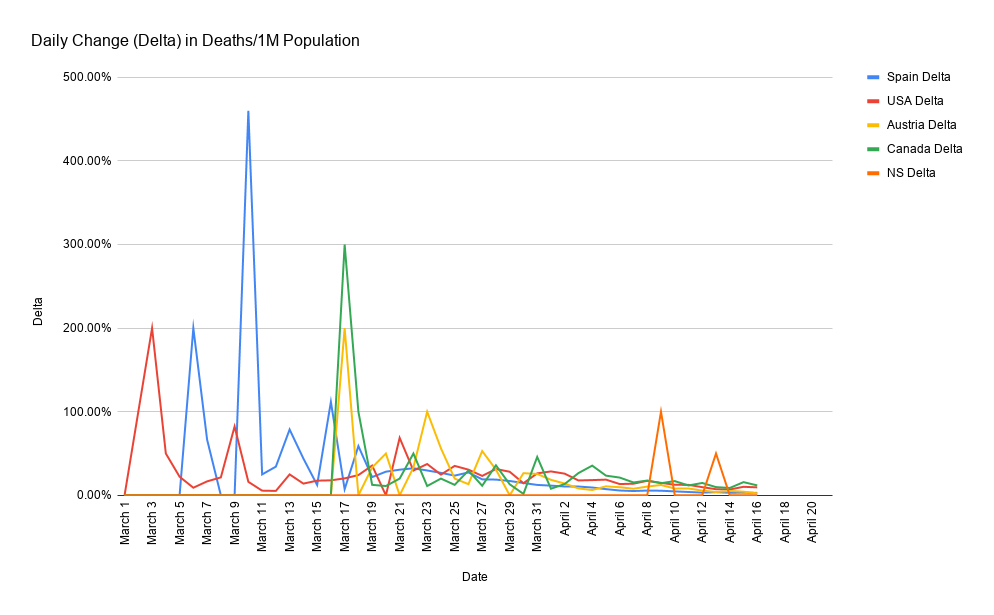
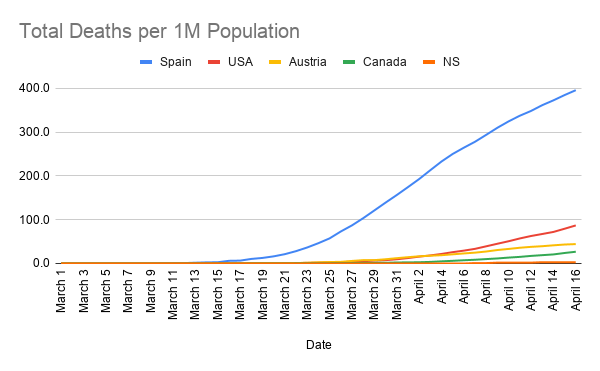
This one is more straight forward. As the title states, this one measures the total, cumulative deaths per 1M population over time. This is the data used to calculate the change that's plotted in Part 1. As the graph in Part 1 approaches 0, ie: the increase in...